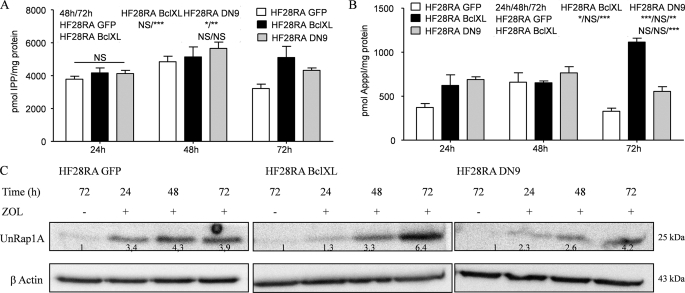
FIGURE 7.
Accumulation of IPP, ApppI, and UnRap1A in HF28RA BclXL and DN caspase-9 cells. The molar amounts of IPP (A) and ApppI (B) were determined in extracts of ZOL-treated cells by using HPLC-ESI-MS. The data are presented as the mean ± S.E. from at least three independent experiments. The statistical significance of the differences was determined using the ANOVA test with the Bonferroni post-test; NS, not significant (p > 0.05); p < 0.05 (*), p < 0.01 (**), and p < 0.001 (***) versus the treated cells (see the data included in the graph). C, shown is the effect of ZOL on Rap1A prenylation as determined by Western blot analysis of UnRap1A in HF28RA control GFP-, BclXL-, and DN caspase-9-transfected constructs. Numbers underneath the bands represent densitometric analysis using ImageJ software, normalized to the internal control (β-actin) and relative to the respective UnRap1A level from an untreated sample, which was set to 1.

