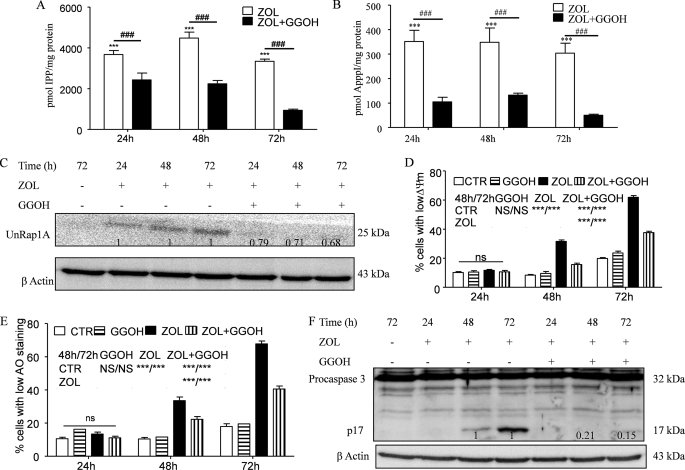
FIGURE 8.
Effect of GGOH on accumulation of IPP/ApppI and unprenylated proteins upon ZOL exposure and their role in ZOL-induced apoptosis. The effect of coincubation with 10 μm GGOH and 50 μm ZOL for different times up to 72 h in the control HF28RA cell line on the accumulation of IPP (A) and the production of ApppI (B) as determined in cell extracts by HPLC-ESI-MS and 1 μm AppCp as the internal standard is shown. Data are the mean ± S.E., n = 4–8; ***, p < 0.001 versus control; ###, p < 0.001 for ZOL alone versus combination with 10 μm GGOH. C, shown is a Western blot analysis of UnRap1A kinetic in HF28RA GFP cells treated with ZOL alone or in combination with 10 μm GGOH. Numbers underneath the bands represent densitometric analysis using ImageJ software, normalized by the internal control (β-actin) and relative to the UnRap1A levels from a corresponding ZOL-treated sample which was set to 1. Mitochondrial membrane potential (D) and lysosomal membrane permeabilization (E) were assessed by TMRM and AO, respectively, followed by fluorescence-activated cell sorter analysis. 5000 events per condition were collected for each histogram. Graphs represent the mean values of three independent experiments. Error bars represent the S.E. deviation. Statistical evaluation of the data was performed using the ANOVA test; NS, not significant (p > 0.05); p < 0.05 (*), p < 0.01 (**), and p < 0.001 (***) versus the indicated treated cells (see the symbols included in the graph). CTL, control. F, shown is a Western blot analysis of caspase-3 cleavage kinetic in HF28RA GFP cells treated with ZOL alone or in combination with 10 μm GGOH. Numbers underneath the bands represent a densitometric analysis using ImageJ software, normalized by the internal control (β-actin) and relative to the p17 fragment level from corresponding ZOL-treated sample which was set to 1.

