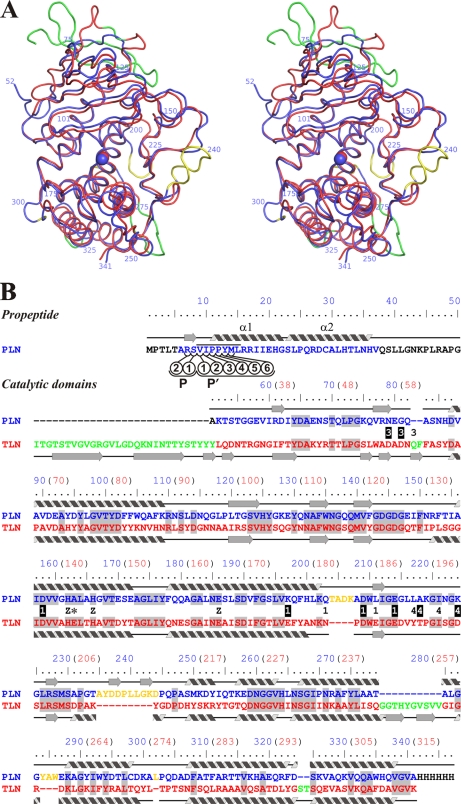
FIGURE 2.
Comparison of three-dimensional structures of protealysin (PLN, blue) and thermolysin (PDB code 8TLN; TLN, red). A, stereoview of superposition of Cα backbones of PLN and TLN (root mean square = 1.06 Å). B, three-dimensional structure-based sequence alignment. Secondary structures of PLN and TLN are presented over and under sequences, respectably. Numbering corresponds to proPLN (numbers in blue); for reference, numbering corresponding to mature TLN is given in parentheses (numbers in red). PLN versus TLN insertions are shown in yellow; TLN versus PLN insertions are shown in green. Residues that are Ca2+ ligands in TLN are marked with numbers: 1, Ca1/2; 3, Ca3; and 4, Ca4. Ligands whose side chains interact with Ca2+ are marked by white numbers on a black background. Z indicates zinc ion ligands; an asterisk indicates the Glu-163→Ala modification site. The residues undetectable in the electron density maps are shown in black. Amino acids identical in PLN and TLN are shaded. The PPL motif is overlined. The propeptide residues interacting with the substrate-binding site are designated as P1, P2, P1′, P2′, P3′, P4′, P5′, and P6′ according to Schechter and Berger (40).

