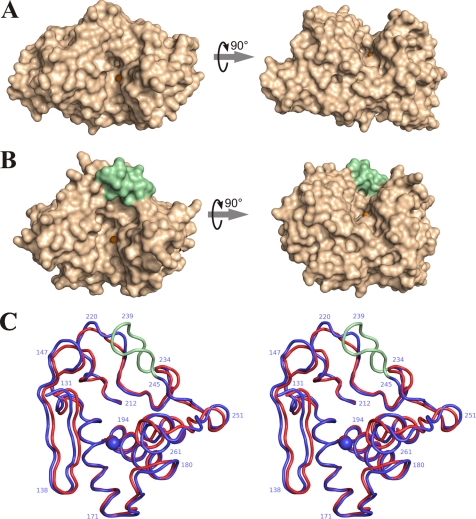
FIGURE 4.
Comparison of active site geometry in thermolysin (PDB code 8TLN) and protealysin. A, surface view of TLN; B, surface view of PLN; C, stereoview of superposition of the Cα backbone in the active site region of TLN (red) and PLN (blue). The AYDD-hairpin is shown in pale green; the catalytic zinc ions are shown as orange spheres; numbering corresponds to proPLN sequence.

