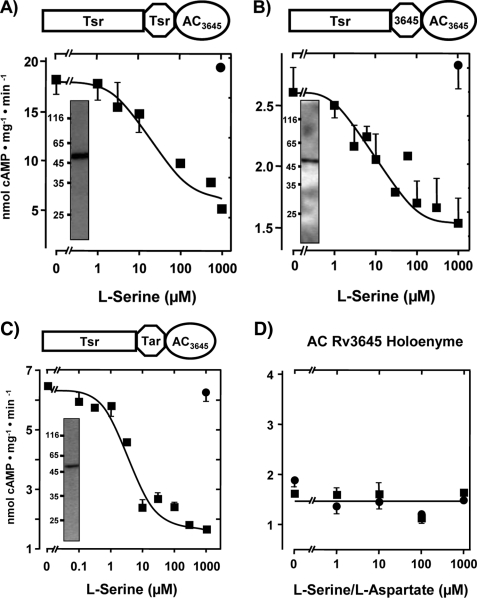
FIGURE 2.
l-Serine inhibits class IIIb AC Rv3645 via the E. coli Tsr chemotaxis receptor. Above each figure a diagram of the chimera is depicted. A, maximal serine inhibition was 71 ± 3%, and the IC50 concentration for serine was 18.5 ± 7 μm (n = 5). Inset, shown is a Western blot with anti-RGSHis6; 4 μg of protein was applied. B, maximal serine inhibition was 45 ± 5%, and IC50 for serine was 15 ± 2 μm (n = 4). Inset, shown is a Western blot with anti-RGSHis6; 3 μg of protein was applied. C, maximal serine inhibition was 73 ± 2%, and IC50 for serine was 4.2 ± 1 μm (n = 6). Inset, shown is a Western blot with anti-RGSHis6; 4 μg of protein was applied. Filled circles are controls with 1 mm l-aspartate. Rectangle, receptor part; octagon, HAMP domain; ellipse, AC catalytic domain; Tsr, serine chemotaxis receptor; Tar, aspartate chemotaxis receptor; AC3645, catalytic AC domain from Rv3645. D, control with expressed AC Rv3645 demonstrates that neither l-serine (filled squares) nor l-aspartate affected activity.

