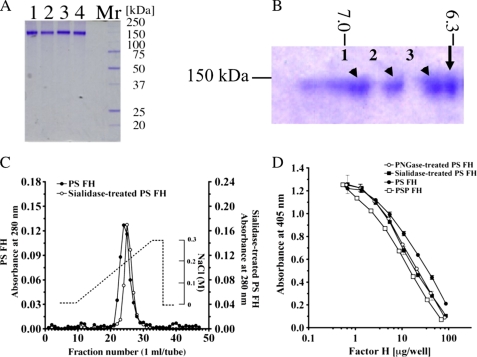
FIGURE 4.
Comparison of molecular weight, pI, heparin-binding activity, and regulation of AP complement activation between PS FH and glycosidase-treated PS FH. A, SDS-PAGE of PNGase F-treated PS FH (lane 1), sialidase-treated PS FH (lane 2), PS FH (lane 3), and PSP FH (lane 4). Five μg of each FH was loaded and stained with Coomassie Brilliant Blue R-250. These proteins were applied to complement regulatory assay. B, two-dimensional electrophoresis of a mixture of purified PS FH (arrow) and sialidase-treated purified PS FH (arrowhead). A mixture of 5 μg of each FH was loaded, electrophoresed, and stained with Coomassie Brilliant Blue R-250. PS FH was a single spot and the pI was 6.31. Sialidase-treated purified PS FH showed triple spots, and the pI values were 6.92 (1), 6.82 (2), and 6.40 (3), respectively. C, comparison of heparin-binding activities of PS FH and silidase-treated purified PS FH. Approximately 1 mg of purified PS FH (filled circles) and the same amount of sialidase-treated purified PS FH (open circles) were applied onto a HiTrapTM heparin column. Each protein was eluated with a linear gradient from 0 to 0.3 m NaCl. D, AP complement regulatory activities of PS FH (filled circles), PNGase F-treated PS FH (open circles), sialidase-treated PS FH (filled squares), and PSP FH (open squares). The assay was carried out on an LPS-coated microtiter plate. Each value is the mean ± S.E. from triplicate experiments.

