
FIGURE 4.
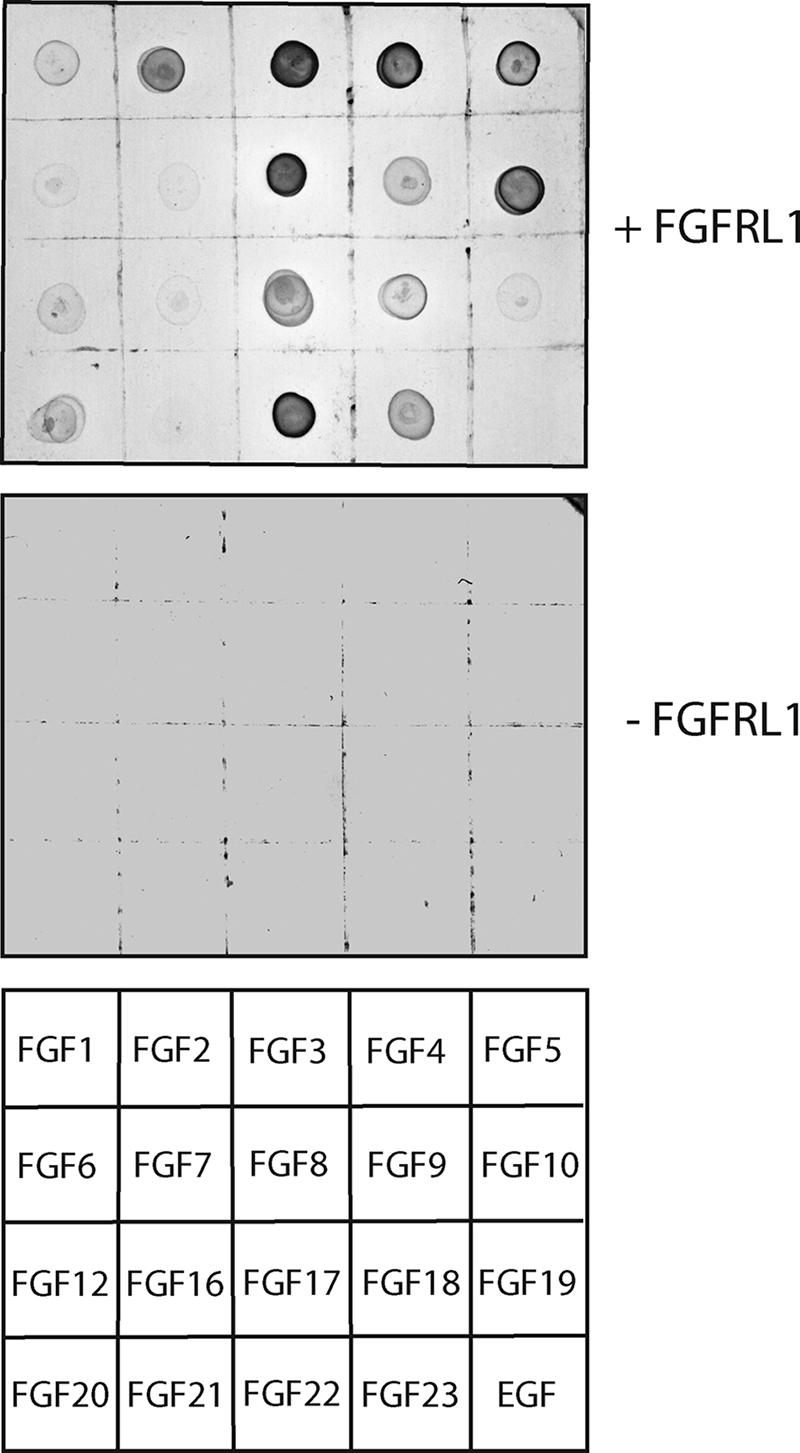
Ligand dot blot analysis reveals differential FGF binding preferences of human FGFRL1. Soluble, Myc-tagged FGFRL1 was used to probe a blot of spotted recombinant FGFs (200 ng each). In the control blot, Myc-tagged FGFRL1 was omitted. The bottom panel shows the positions of the spotted FGFs and the control epidermal growth factor on the blot.