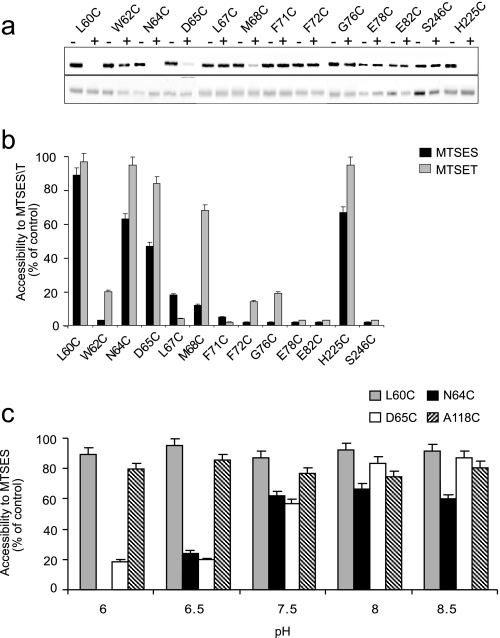
FIGURE 4.
Accessibility of Cys replacements in TMS II to MTSES/MTSET from the periplasm. Intact cells expressing the Cys-replacement mutants in TMS II of Cys-less NhaA were incubated with MTSES or MTSET as described under “Experimental Procedures” at pH 7.5. Proteins were purified by Ni2+-NTA affinity chromatography and labeled on the beads with fluorescein maleimide for estimating the percentage of free cysteines remaining. The eluted proteins were resolved on SDS-PAGE, and the fluorescence level was monitored and photographed under UV light. Then, the gel was stained with Coomassie Blue and photographed under ordinary light to assess the protein concentration. a, MTSES (top panel, fluorescence of fluorescein-maleimide; bottom panel, protein level). b, the fluorescence intensity was normalized by the respective protein concentration and expressed in % of the fluorescence intensity of the untreated control. Accessibility to MTSES/T = 100% − % fluorescent intensity of the treated sample, and is presented by bars. The standard deviation was between 5 and 10% as indicated. Black bars, accessibility to MTSES; gray bars, accessibility to MTSET. c, intact cells expressing the indicated variant were incubated with MTSES at different pH values (pH 6–8.5) and processed as above. The standard deviation was between 5 and 10% as indicated (error bars).

