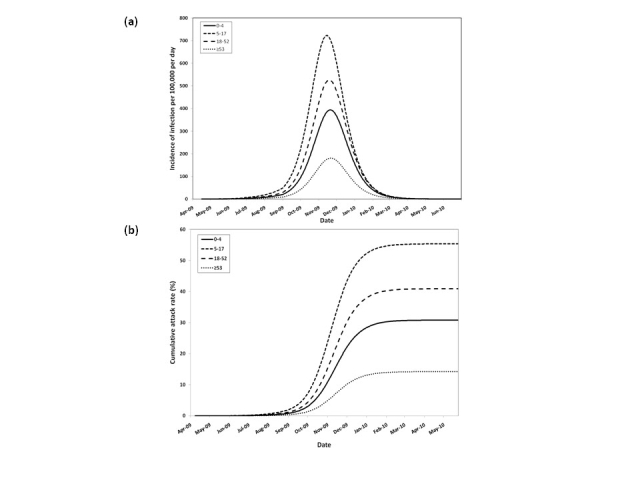
Figure 3. (a) Simulated age-stratified daily pH1N1 infection incidence per 100,000 population and (b) age-specific attack rates between April 2009 and June 2010, in the absence of vaccination or other interventions. Both symptomatic and asymptomatic cases are shown. The curves are based on an assumption of fifty percent pre-existing immunity in the ≥53 age group and a decrease in R0 from 1.3 to 1.15 between July and September.