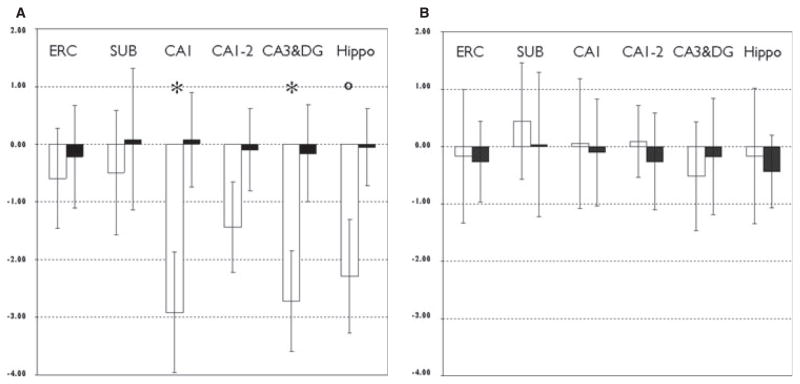
Figure 2.
Mean and standard deviation of (A) sclerotic and (B) nonsclerotic subfield z-scores in TLE-MTS (white bars) and TLE-no (black bars). *Indicates p < 0.05 compared to CA2. Indicates p < 0.05 compared to ERC and SUB. ERC, entorhinal cortex; SUB, subiculum; CA1, CA1; CA1-2, CA1-2 transition; CA3&DG, CA3 and dentate gyrus; Hippo, total hippocampal volume.
Epilepsia © ILAE

