
FIG. 4.
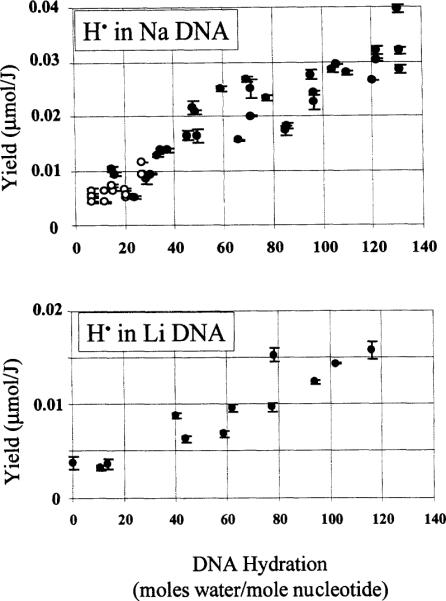
Yield of hydrogen atoms in Na and Li DNA as a function of DNA hydration. Each data point represents one dose-response curve determined from four or five data points. The error bars are ± 1 SD of the slope of the dose-response curve. The yields were obtained by integrating only the low-field line and multiplying by 2. Hydrogen-atom yields reflect hydrogen atoms in the quartz sample holder and in the DNA sample. Open and closed circles are as defined in the legend to Fig. 2.