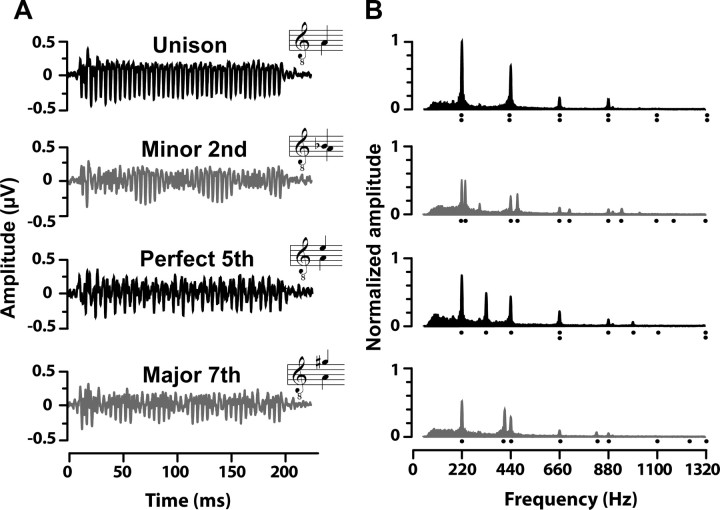
Figure 2.
Grand-average FFR waveforms (A) and their corresponding frequency spectra (B) elicited from the dichotic presentation of four representative musical intervals. Consonant intervals are shown in black, dissonant intervals in gray. A, Time waveforms reveal clearer periodicity and more robust amplitudes for consonant intervals than dissonant intervals. In addition, dissonant dyads (e.g., minor second and major seventh) show significant interaction of frequency components as evident from the modulated nature of their waveforms. Insets show the musical notation for the input stimulus. B, Frequency spectra reveal that FFRs faithfully preserve the harmonic constituents of both musical notes even though they were presented separately between the two ears (compare response spectrum, filled area, to stimulus spectrum, harmonic locations denoted by dots). Consonant intervals have higher spectral magnitudes across harmonics than dissonant intervals. All amplitudes are normalized relative to the unison.

