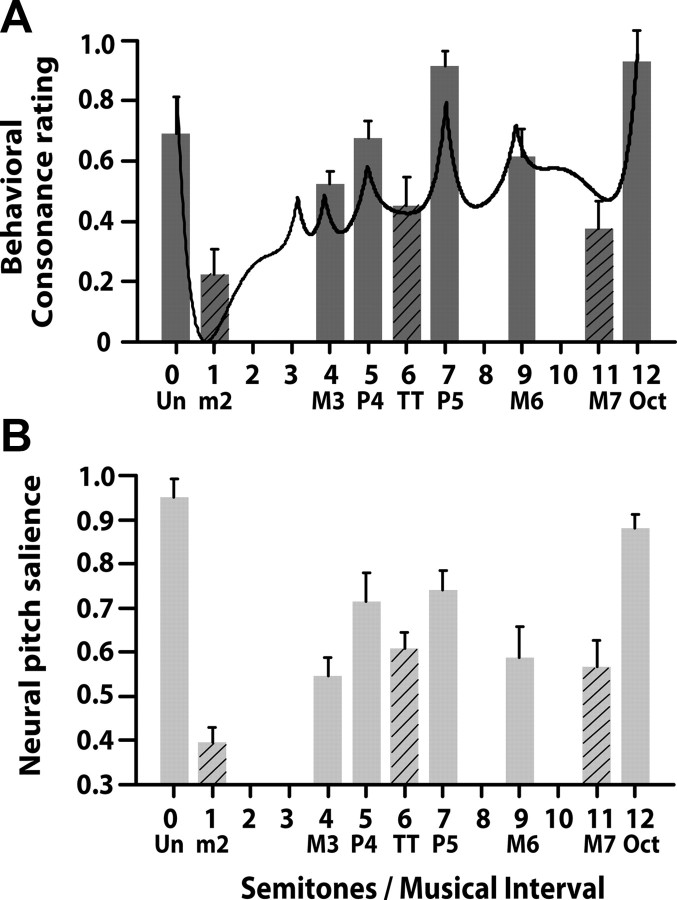
Figure 3.
Perceptual consonant ratings of musical intervals and estimates of neural pitch salience derived from their respective FFRs. Solid bars, Consonant intervals; hatched bars, dissonant intervals. A, Mean behavioral consonance ratings for dichotic presentation of nine musical intervals. Dyads considered consonant according to music theory (solid bars) are preferred over those considered dissonant [minor second (m2), tritone (TT), major seventh (M7)]. For comparison, the solid line shows predictions from a mathematical model of consonance and dissonance (Sethares, 1993) in which local maxima denote higher degrees of consonance than minima, which denote dissonance. B, Mean neural pitch salience derived from FFR responses to dichotic musical intervals. Consonant intervals produce greater pitch salience than dissonant intervals. Even among intervals common to a single class (e.g., all consonant intervals) FFRs show differential encoding resulting in the hierarchical arrangement of pitch described by Western music theory. Error bars indicate one SEM.

