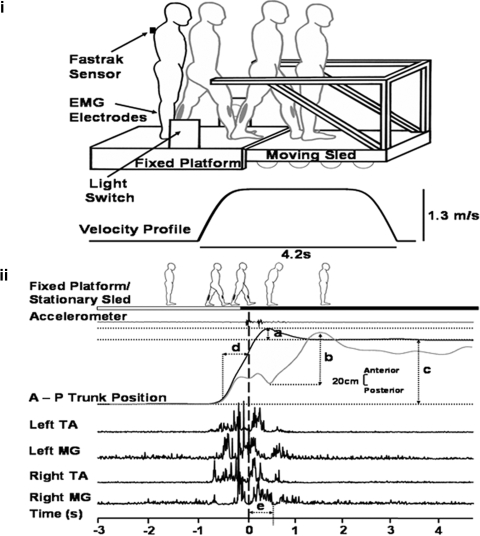
Fig. 1.
Experimental setup and analysis. Top (i): experimental setup showing how the subject walks from the fixed platform with the right leg and landing on the moving sled with the left leg. Note the diagram represents a stationary trial; during moving trials, sled motion will be triggered by the subjects leg passing through the light switch. A Fastrak sensor placed on C7 recorded linear trunk position along the antero-posterior axis. Electromyographic (EMG) electrodes placed on the lower legs recorded muscle activity of tibialis anterior (TA) and medial gastrocnemius (MG). Below the sled diagram, the stimulus velocity profile shows the speed (1.3 m/s) and duration of the sled movement (4.2 s). Bottom (ii): measurements taken: a: trunk (forward) sway (during BEFORE and AFTER trials) measured as the maximum forward deviation of the trunk, relative to the mean final resting stance position in the last 3 s of the trial. b: trunk sway (during MOVING trials) measured as maximum forward deviation of trunk peak to peak. c: distance traveled measured as mean of the starting position in the 1st 3 s relative to the final mean resting stance in the last 3 s of a trial. d: gait velocity as measured in a 0.5 s time window prior to foot contact. e: EMG measured as an integral value from an epoch of 500 ms from initial foot-sled contact (= time 0, vertical broken line).

