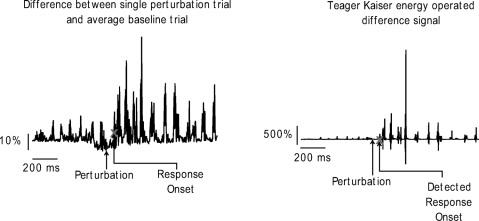
Fig. 2.
Example of the Teager Kaiser Energy operation on the EMG signal. Left: the difference between a perturbation response and the average baseline response for the anterior deltoid muscle. Right: the same difference signal after the Teager Kaiser energy operation. ×, the detected reflex onset latency.

