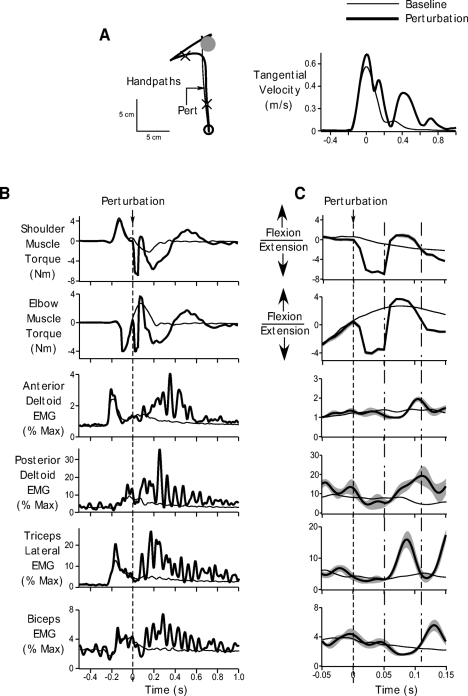
Fig. 3.
Performance during baseline and unimanual perturbation trials. A: ensemble averaged handpaths (left) and tangential hand velocity profiles (right) during baseline movements (thin black) and unimanual perturbation trials (thick black). Arrow on the handpath profile shows the time of perturbation. The cross hairs represent the time from 50 ms prior to 150 ms after the perturbation. B: torque and electromyographic (EMG) data associated with baseline (thin black) and perturbation trials (thick black). Ensemble averaged shoulder and elbow muscle torque, and anterior deltoid, posterior deltoid, triceps lateral and biceps EMG are shown. Data are shown from 500 ms prior to 1 s after the perturbation. Dotted line indicates perturbation onset. C: same data as in B, but time axis is restricted from 50 ms before to 150 ms after the perturbation to better demonstrate the effects of the perturbation and the associated muscle responses. Gray bands represent standard error of the ensemble averages. Dotted line represents perturbation onset. The time between the dotted-and-dashed lines represents the reflex interval from 50 to 110 ms after the perturbation. All data are for a representative subject.

