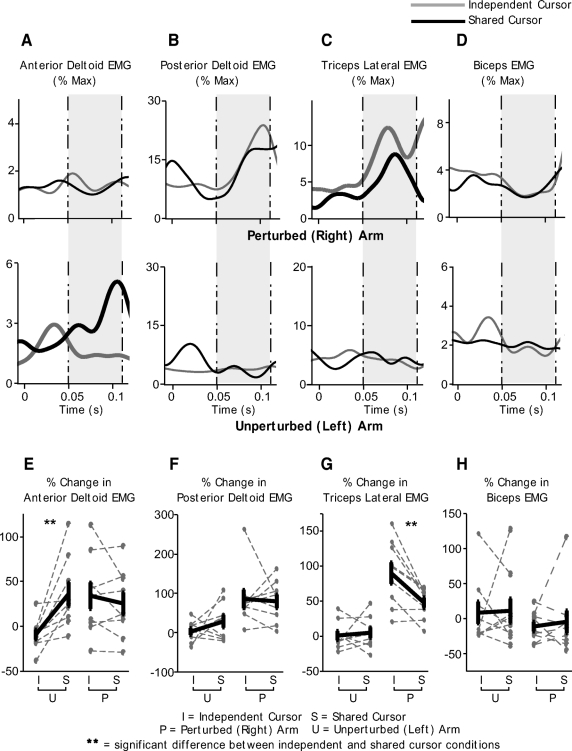
Fig. 6.
Comparison of responses in the independent- and shared-cursor conditions. A–D: ensemble averaged EMG responses in the independent-cursor (gray) and shared- cursor (black) conditions for the same representative subject as in Figs. 3–5 during trials on which a perturbation is applied to the right arm. Anterior deltoid (A), posterior deltoid (B), triceps lateral (C), and biceps (D) responses are shown. Top: data for the perturbed (right) arm; bottom: data for the unperturbed (left) arm. Time 0 indicates when the perturbation was applied to the right arm. The time between the dotted-and-dashed lines (shaded gray area) represents the reflex interval from 50 to 110 ms after the perturbation. E–H: percent change in EMG response in the independent- and shared-cursor conditions for the perturbed (right) and unperturbed (left) arms. Data for anterior deltoid (E), posterior deltoid (F), triceps lateral (G), and biceps (H) are shown. Dotted gray lines show data for each individual subject while thick black lines represent the mean ± SE across all our subjects.

