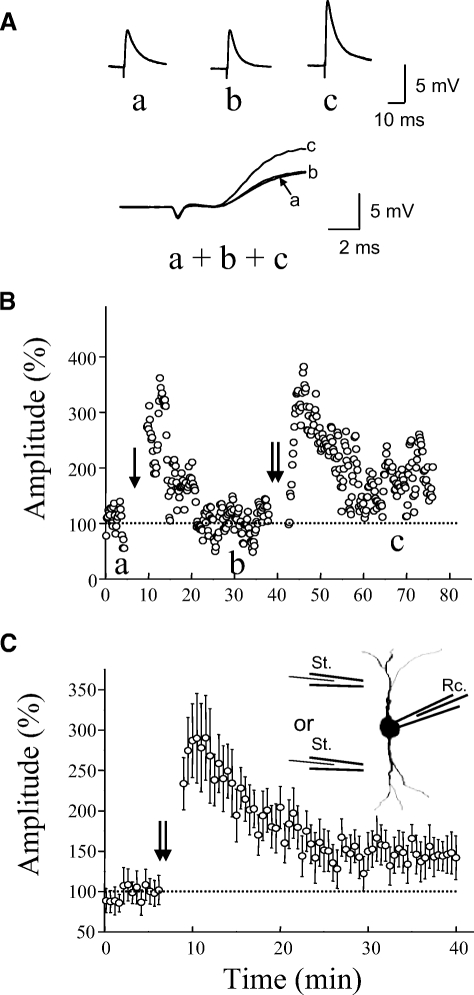
Fig. 2.
LTP induced in excitatory synapses on eGFP-expessing interneurons by TBS. A: the top traces (a, b, and c) were from a representative cell taken at times marked by letters in B. Bottom traces show superimposed responses with an expanded timescale. Each trace was an average of 10 consecutive responses. B: a representative cell showing STP and LTP of EPSPs induced by 4 episodes (single arrow) and 10 episodes (double arrows) of TBS, respectively. C: summary data showing LTP induced by TBS without blocking NMDARs (n = 9). Double arrows in C and the following figures indicate TBS of 6 to 10 episodes. Inset: a schematic diagram showing the arrangement of the recording electrode and stimulation electrodes. LTP, long-term potentiation; TBS, theta burst stimulation; STP, short-term plasticity; EPSP, excitatory postsynaptic potential.

