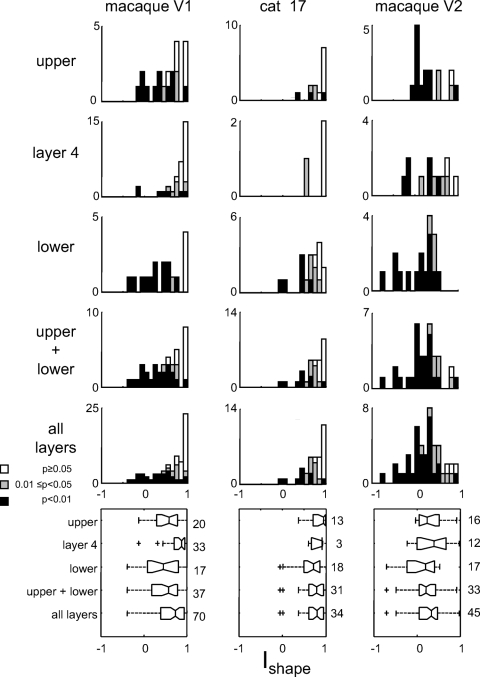
Fig. 3.
Population summary of the dependence of the effective receptive field (RF) shape on basis set. The index Ishape (Eq. 4) measures the similarity between the RF sensitivity profile measured with Cartesian TDH functions, vs. with polar TDH functions (see methods). Values of Ishape significantly <1 indicate departure from the expected behavior of a linear–nonlinear (LN) cascade. Portions of the histograms (stacked) shaded black represent units for which Ishape <1 at P < 0.01; portions shaded gray are significant at 0.01 ≤ P < 0.05; unshaded portions correspond to P > 0.05. Boxplot notches indicate 95% confidence limits on median (located at the angle of the notch); boxplot size indicates interquartile range; “+” signs indicate outliers; numbers to the right of each plot indicate the number of units.

