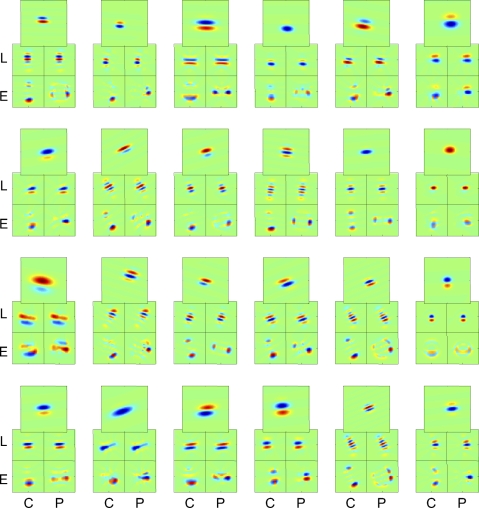
Fig. 6.
Numerical simulation of the effect of a simple model of contrast normalization. In each set of profiles, the large profile is the receptive field sensitivity profile, i.e., a Gabor function G(x,y). The 2 × 2 map set underneath are the L- and E-filters estimated from simulated responses in which the output of this filter is divisively normalized by an isotropic (unoriented) local contrast signal, derived by combining the output of similar nearby Gabor filters. Note that the filters Lcart and Lpolar estimated from responses to Cartesian and polar TDH stimuli are nearly identical. For further details, see methods.

