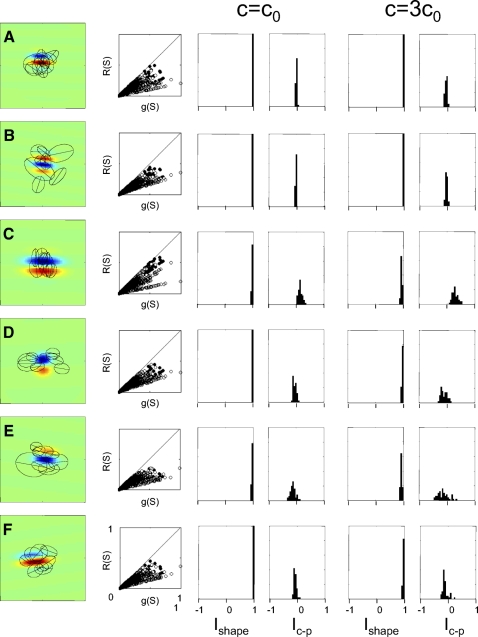
Fig. 7.
Numerical simulation of the effect of several kinds of normalizations and orientation-specific interactions on RF indices. Characteristics of the auxiliary neurons that provide the normalization or interaction signal are as follows: A: randomly oriented, coextensive with the target neuron RF (center SD identical to RF envelope parameter σ). B: randomly oriented, more widely distributed than the target neuron RF (center SD 2σ). C: as in A, but orthogonal orientations (SD 11.25°) to the modeled neuron. D: as in A, but same orientation as the modeled neuron and positioned, on average ±σ away from its center (oriented end-zone inhibition) along the axis of RF orientation. E: as in A, but centers within a radius of σ excluded, and same orientation as modeled neuron (iso-orientation suppression from the nonclassical RF). F: as in E, but orientations differ from the modeled neuron by ±30° (side-band suppression from the nonclassical RF). The 1st column shows examples of specific neurons simulated, with the modeled neuron's sensitivity profile in pseudocolor and typical auxiliary neurons diagrammed by the 1/e level curves of their envelopes. (For clarity, only 8 auxiliary receptive fields are diagrammed; Naux = 120 were used in each simulation.) The 2nd column is a scattergram of the raw responses of the model neurons to each TDH stimulus [g(S), Eq. 8] and its response following normalization [R(S), Eq. 11], for Cartesian stimuli (filled) and polar stimuli (empty) for c = c0, indicating that the normalization had a large effect on response size. The remaining 2 pairs of columns are histograms of the indices Ishape and Ic−p, for the standard normalization strength c = c0 (columns 3 and 4) and c = 3c0 (columns 5 and 6). Note that the bin width used in this figure (0.05) is half of the bin width used in Figs. 3 and 4 because the distributions of the indices derived from simulations are tightly clustered.

