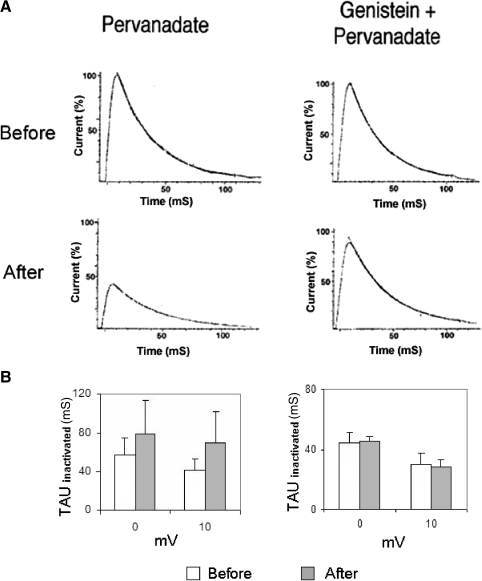
Fig. 13.
Pervanadate slowed the inactivation kinetics of IA. A: examples of single-exponential fits of current records of IA inactivation (at 0 mV), before (top) and 10 min after (bottom) pervanadate treatment. Currents suppressed by pervanadate (bottom) have been scaled relative to the preionophoresis records. Pervanadate slowed IA inactivation by roughly 38% (left). Genistein prevented the changes in IA inactivation rate (right). B: summary data for effects of pervanadate on tauinactivate, in the absence (left) or the presence (right) of genistein. Averages given are for 5 (pervanadate) and 3 (pervanadate/genistein) cells, respectively. Data were obtained about 10 min after pervanadate ionophoresis at 0 and +10 mV.

