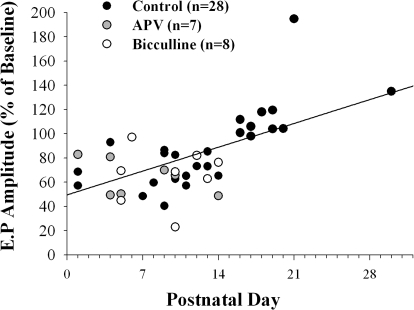
FIG. 5.
A scatterplot showing the magnitude and polarity of tetanus-induced changes in the amplitude of field potentials measured at 60 min at different postnatal ages. Each point depicts a single case and the different symbols represent animals recorded under control conditions (n = 28) or when d-AP5 (n = 7) or bicuculline (n = 8) were added to the bath. The best-fit line shows a significant linear correlation between postnatal age and the polarity of tetanus-induced changes (n = 43, r2 = 0.358, P < 0.0001). At ages when LTD (P1–P14) or LTP (P16–P30) prevailed, neither group by itself showed a significant change in amplitude with age (LTD: P1–P14, n = 33, r2 = 0.009, P < 0.59; LTP: P16–P30, r2 = 0.18, P < 0.21).

