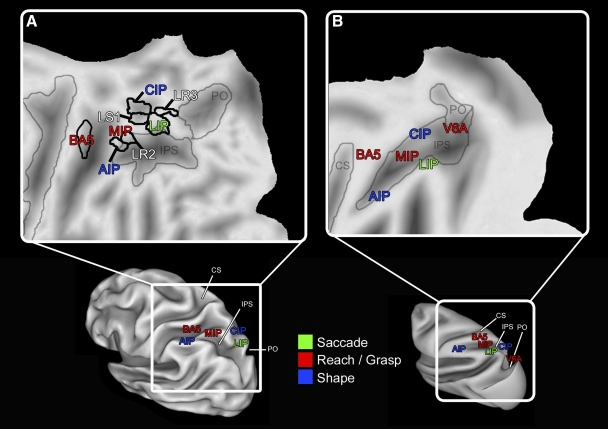
Fig. 6.
Summary of the organization of PPC in humans (A) and macaque monkeys (B) illustrated on a flattened (top figures) and inflated (bottom figures) cortical atlas for either species. Lateral views of the left hemisphere show the layout of regions hypothesized to be homologous across the 2 species and areas that were multifunctional in the present study (white letters). The general layout of areas relative to each other is similar across species. Color represents the body structure(s) from which these regions process information. Faint gray lines denote borders between sulci and, in the human, black lines denote boundaries between functional areas. Conventions as in previous figures. See Tables 1 and 2 for abbreviations. Human and macaque atlas courtesy of the Surface Management Systems Database (http://sumsdb.wustl.edu:8081/sums/directory.do?id=636032). Part B was adapted from Colby (1998) and Andersen and Buneo (2002).

