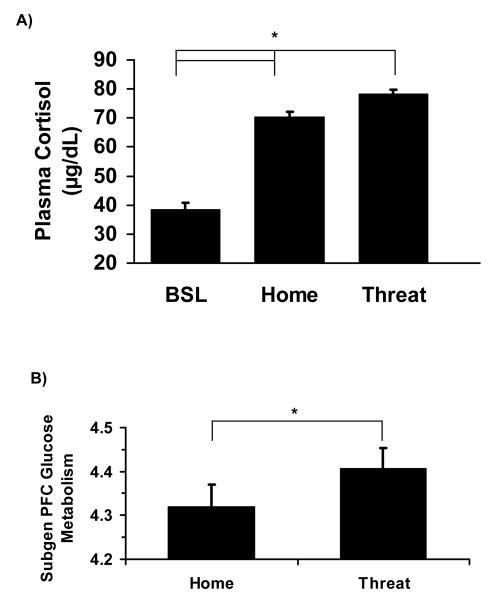
Figure 1.
For Experiment 1, the two threat conditions included: alone in a test cage (ALN) and no eye contact (NEC). The two home-cage conditions included: home alone (H-ALN) and home with cagemate (H-CM). (a) Both threat and home-cage conditions produced a greater cortisol response compared to baseline morning cortisol after controlling for time of day, t’s (34) > 8.68, p’s < .001. Threat conditions produced a greater cortisol response compared to the home-cage conditions after controlling for time of day, t(34) = 4.79, p < .001. Differences between conditions were also significant when using raw cortisol levels, F(4, 136) = 73.97, p < .001; all t’s > 3.10, p’s < .005. Graphically, raw cortisol values are presented. (b) Threat conditions produced higher relative cerebral glucose metabolism in the subgenual prefrontal cortex (PFC) than home conditions, t(34) = 3.10, p < .005. Error bars represent standard error of the mean.

