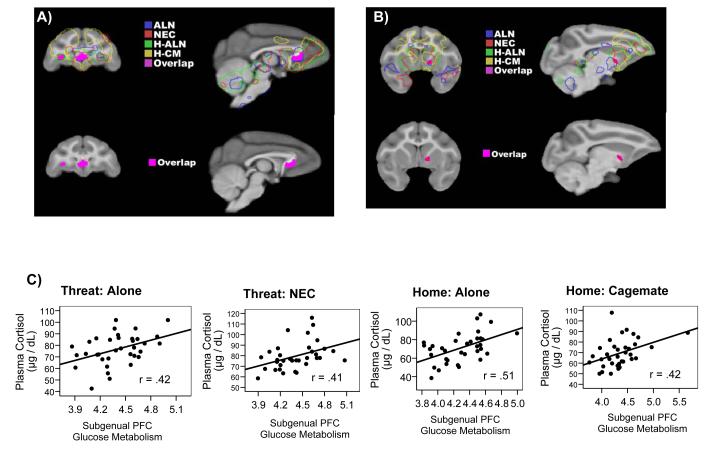
Figure 2.
Correlations for Experiment 1 between glucose metabolism and cortisol across multiple contexts. (a & b) Upper images: Correlational brain maps where traced outlines indicate brain regions where cortisol is positively correlated with metabolism for each condition. Each color represents one of the four conditions. The solid pink areas represent the brain regions of overlap where cortisol and glucose metabolism are correlated across all 4 conditions as identified using the logical AND conjunction analysis. Lower images: Isolated image of brain regions of overlap (solid pink). (a) Anterior sagital and coronal slices depicting subgenual PFC and the left OFC where cortisol correlates with glucose metabolism across all 4 conditions. (b) A more lateral, sagital slice and more posterior, coronal slice showing the region encompassing the BNST/NAC where cortisol correlates with metabolism in all 4 conditions. (c) Subgenual PFC: Scatter plots of the relationship between metabolism in the subgenual PFC and cortisol in each of the 4 conditions. (Threat Conditions: alone [ALN] and no eye contact [NEC]); Home-cage Conditions: home alone [H-ALN] and home with cagemate [H-CM]).

