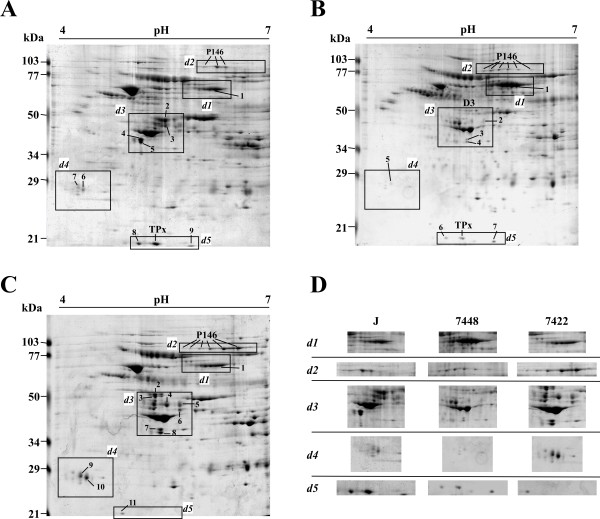
Figure 1.
2DE proteome profiling the three M. hyopneumoniae strains with IEF at pH 4-7. Protein samples (2 mg) from the M. hyopneumoniae strains J (A), 7448 (B), and 7422 (C) were separated by IEF using 17 cm pH 4-7 IPG strips, followed by SDS-PAGE on 12% gels and stained with Coomassie Brilliant Blue G. The approximate molecular weights are shown on the left of the gel and the acid-to-alkaline gradient is from left to right. The rectangle delimited areas (numbered d1-d5) in the gels and panels in (D) show gel regions in which spots corresponding to differentially expressed proteins were identified. Spots corresponding to proteins identified by matching to the previously reported M. hyopneumoniae 7448 proteome maps [16] were named according to the predicted gene products. Spots corresponding to proteins thus far unidentified in proteome maps were numbered.

