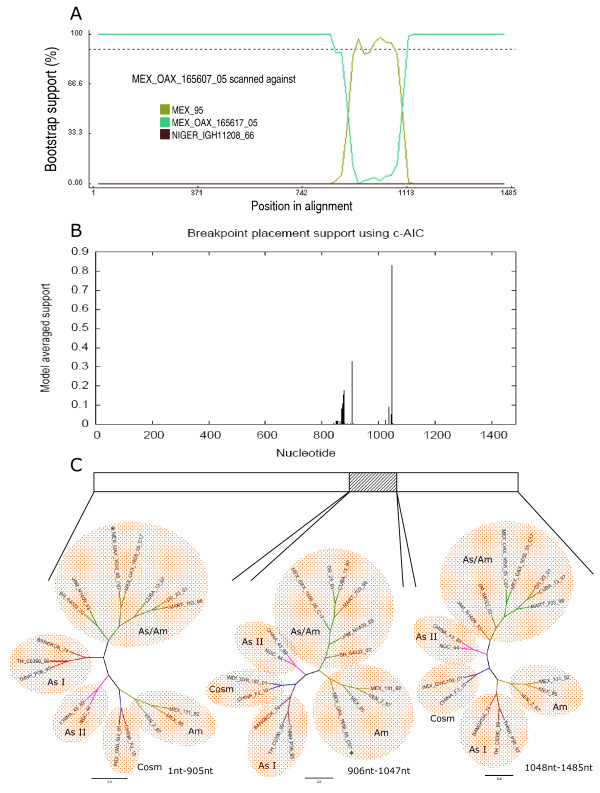
Figure 5.
Recombination plots of clone MEX_OAX_165607_05 of E protein gene. A) BOOTSCAN plot resulted from the analysis of the clone MEX_OAX_165607_05 sequence with 1000 bootstrap, the putative mayor parent MEX_OAX_165617_05, and the putative minor parent MEX_95; B) Breakpoints plot obtained with GARD algorithm by using the sequences as above; C) Phylogenetic trees (E gene) based on putative recombination and non-recombination regions by maximum likelihood methods.

