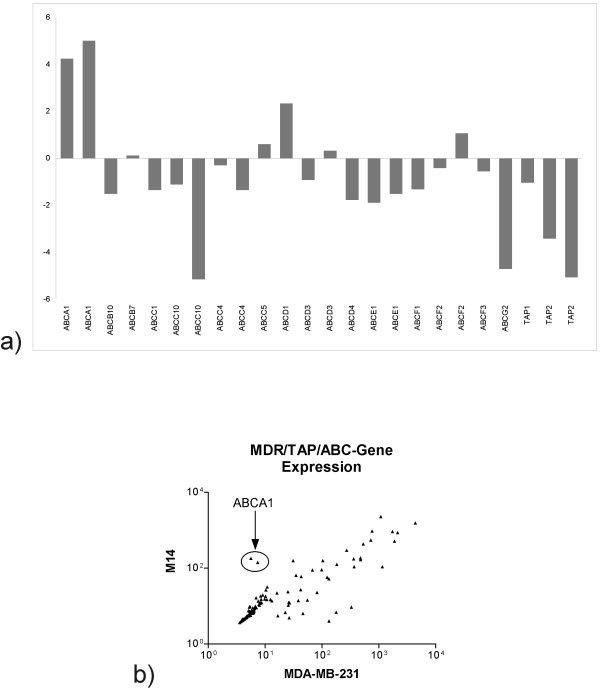
Figure 4.
Expression of ABC genes in M14 cells as compared to the Curcumin sensitive cell line MDA-MB-231. Gene expression was analyzed using Affymetrix HU133plus2 arrays in M14 and MDA-MB-231 cells. The ratio of intensity levels of all probesets encoding ABC genes above the arbitrary threshold of 100 in M14 versus MDA-MB-231 cells were plotted on a log2 scale (A). All probesets encoding for ABC genes were used for a correlation plot (B).

