Figure 2.

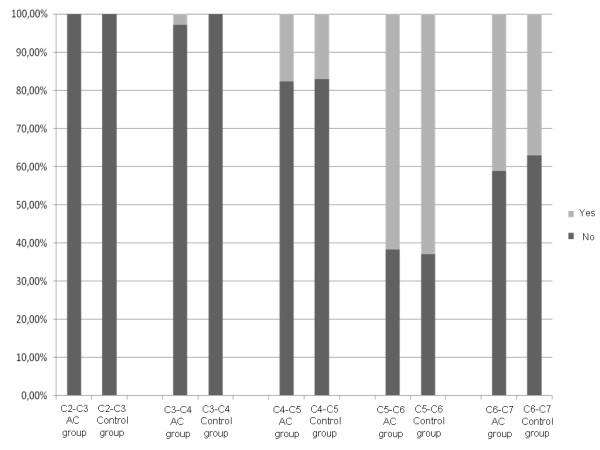
Graphic representation of the prevalence of cervical spine osteophytes at each intervertebral level (p value from 0.08 to 0.93).

Graphic representation of the prevalence of cervical spine osteophytes at each intervertebral level (p value from 0.08 to 0.93).