Figure 5.

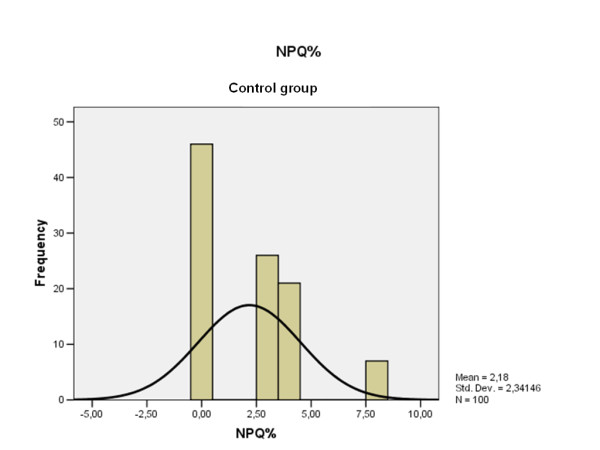
NPQ results distribution obtained by the control group. Note that the current scale is different with respect to the Fig. 4.

NPQ results distribution obtained by the control group. Note that the current scale is different with respect to the Fig. 4.