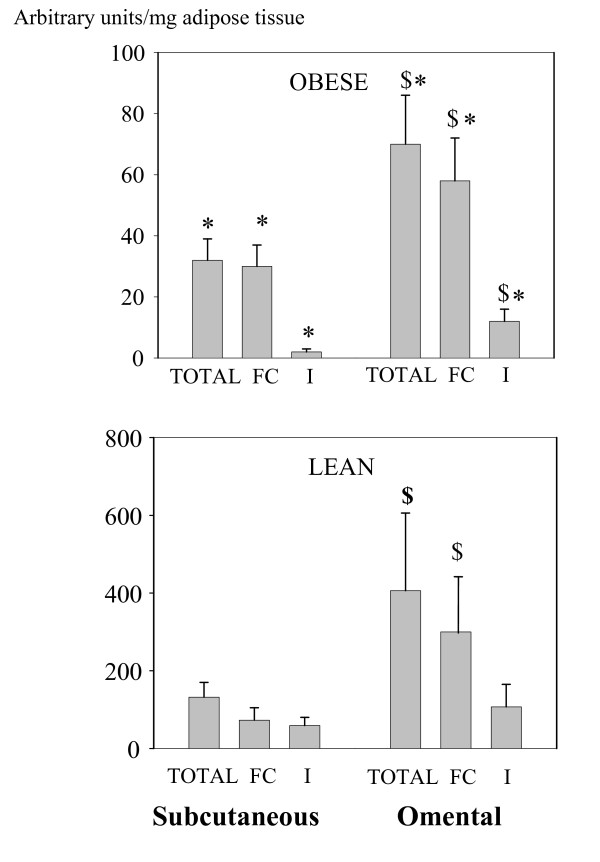
Figure 3.
Quantification of perilipin proteins in subcutaneous and omental adipose tissues of obese (upper graph) and lean women (lower graph). The relative amount was measured in pooled fat-free infranatants (I: I1+I2), fat cakes (FC) and from whole material (Total).* P < 0.05 versus the corresponding value in lean women, $ P < 0.05 versus the corresponding value of subcutaneous tissue in the same group of subjects.

