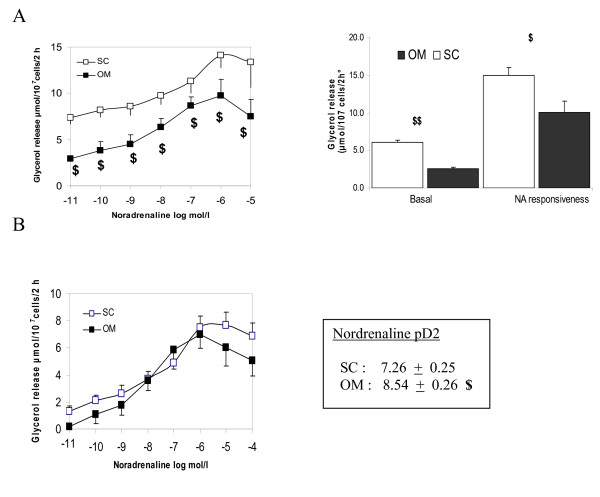
Figure 5.
Regional differences in basal, noradrenaline-stimulated lipolysis in adipocytes isolated from omental (OM) and subcutaneous (SC) adipose tissue. Results are expressed as a function of cell number (A) and cell number minus basal lipolysis (B) in obese women. Data are mean ± SEM. The lipolytic capacity was calculated by dividing the noradrenaline-induced glycerol release per basal glycerol release. An index for the sensitivity to noradrenaline is the pD2 value, the negative logarithm of the EC50 value, which is the concentration of the agonist giving half of its maximum effect. Maximal lipolytic rate of noradrenaline was used as indications of responsiveness. It was calculated by dividing the noradrenaline-induced glycerol release by basal glycerol release. $ P < 0.05 versus the corresponding value of subcutaneous tissue in the same group of subjects $$ P < 0.01 versus the corresponding value of subcutaneous tissue in the same group of subjects.

