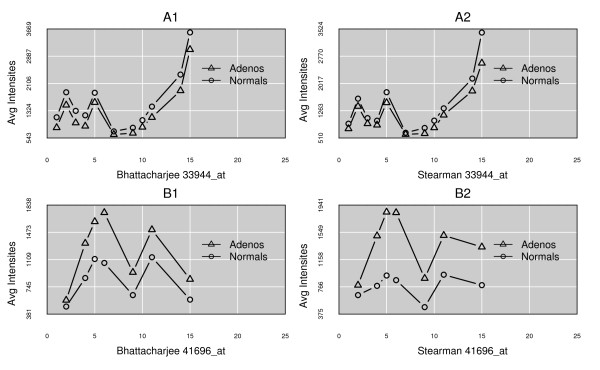
Figure 5.
Measurement Profile Consistency. Measurement profile consistency for a probeset across experiments. One example is given for each of the two types of ProbeSet probe response classification categories: Significantly differentially expressed (DE) or not. Panel A1 is for a non DE ProbeSet in the Bhattacharjee experimental results and A2 is for the same ProbeSet in the Stearman experiment. B1 and B2 are for a DE ProbeSet in each experiment. Mean intensity for the probe in the sample class (fluorescent units) is on the y-axis and probe index within the given ProbeSet is given on the x-axis. Intensities are not on the same scale for the two experiments since the labelling was done independently; it is the patterns and relative intensities that are conserved.

