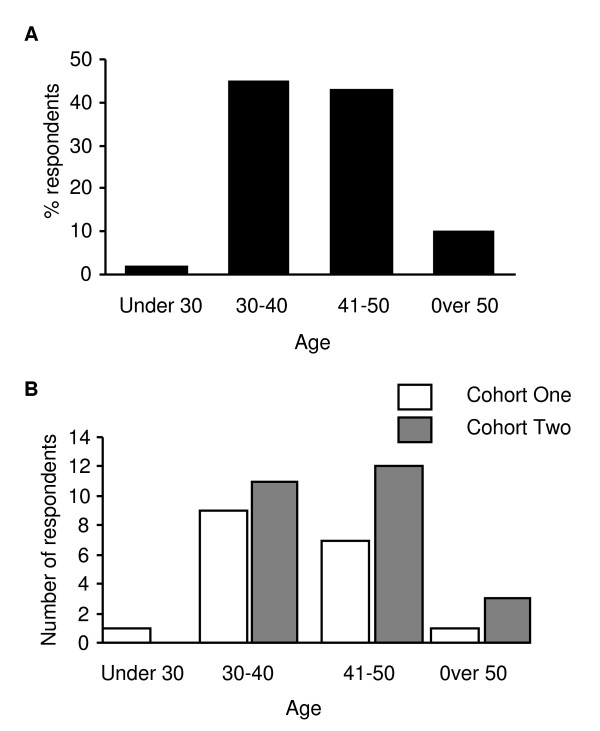
Figure 1.
Participant age demographics. A - This graph demonstrates the age profile of students accessing the non-medical prescribing course who returned the postal questionnaire - combined data from two cohorts of students (n = 44). B - This graph demonstrates the age profile of students from two separate cohorts who returned the postal questionnaire. Cohort one n = 18. Cohort two n = 26.

