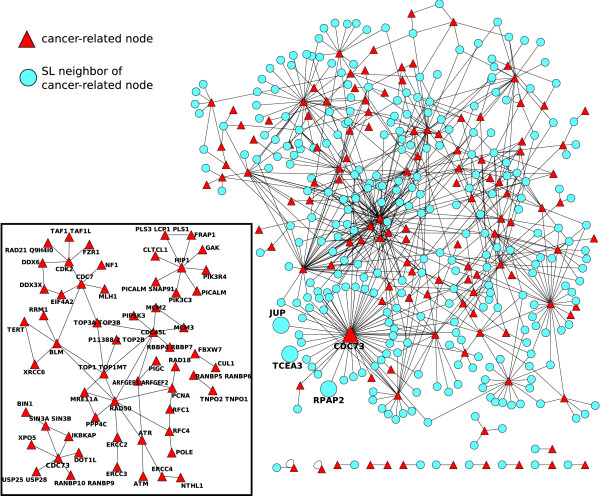
Figure 7.
Cancer-related genes and their first neighbors from the SL human network (Additional file 6). The inset illustrates the sub-network of cancer-related nodes alone (59 nodes). Nodes without SL partners (65 of 124) were eliminated from this picture. In the large network, both cancer-related (triangles) and their neighbors (circles) in the SL human network. Only the links connecting a cancer-related gene and its neighbor (411 nodes and 694 links) are illustrated.

