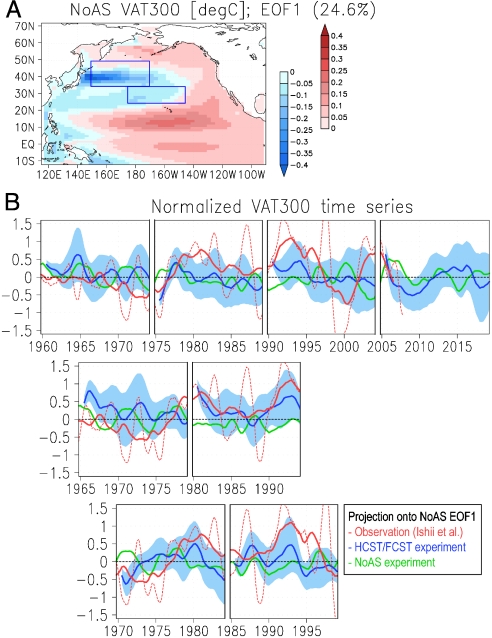
Fig. 3.
Hindcasted, forecasted, and observed time series of the leading mode of internal decadal variations in upper-ocean temperature over the North Pacific. (A) Spatial pattern of the leading EOF of the North Pacific VAT300 deviations from the externally forced variation in the NoAS data during 1958–2017. (B) The projections onto the leading EOF [i.e., (A)] for annual-mean VAT300 deviations in the HCST/FCST (blue lines) and NoAS data (green lines) and in the observation (broken red lines), respectively. Solid red lines are 5-year-running mean values in the observation. Blue shades represent the ranges of 1 SD of the 10 ensembles of the projected deviations in the HCST/FCST data. Plotted values are normalized using the SD of the observations.

