Fig. 3.
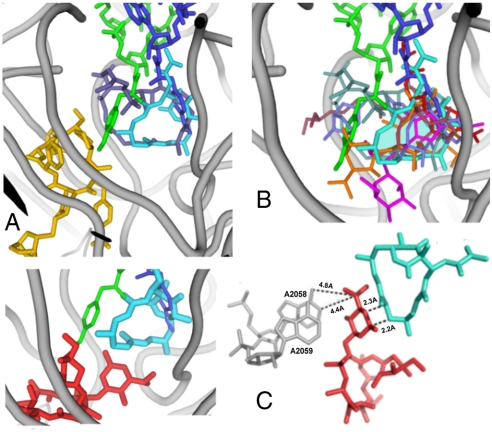
Antibiotics in PTC and NPET of the ribosome. In all the panels, LC is shown in cyan and the amino acid-esterified 3′ ends of A- and P- sites tRNAs are in blue and green, respectively (42). Ribosomal RNA backbone is colored in gray. (A) Superposition of LC and an SA compound dalfopristin (metallic blue) in PTC (6). The dalfopristin’s mate SB component, quinupristin, in the NPET (6) is shown in gold. (B) Superposition of LC and several other PTC-targeting antibiotics in their D50S binding sites: A section through the volume occupied by LC is shown in transparent cyan; the drugs shown are: clindamycin (3) in magenta, tiamulin (5) in purple; retapamulin (9) in slate, chloramphenicol (3) in red, dalfopristin (6) in metallic blue and methymycin (14) in orange and quinupristin (6) in gold. (C) Left: The relative positions of LC and ERY (red, from ref. 3) in D50S; right: The marked short distance between LC and ERY indicates a potential steric clash, thus explaining the competition of the two drugs for binding to the ribosome.

