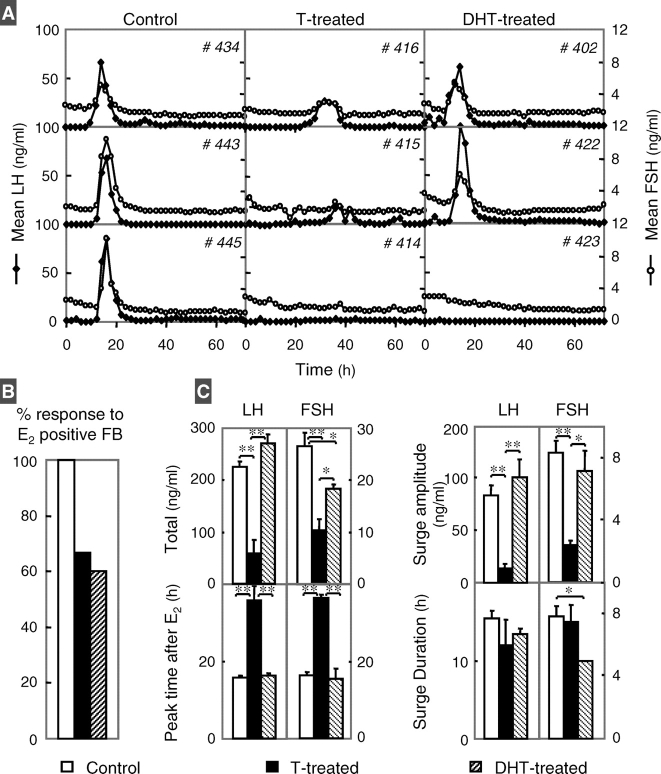
FIG. 3.
Results of E2-positive feedback test conducted during the prepubertal period (∼20 wk of age). A) Two-hour circulating patterns of LH (black diamonds) and FSH (white circles) from three control (left), three prenatal testosterone (T)-treated (middle), and three prenatal DHT-treated females (right). B) Percentage of females that responded to the positive E2 feedback challenge by eliciting an LH surge. C) Mean ± SEM of total LH and FSH released during the surge and amplitude of LH and FSH surges are shown in the top left and right panels, respectively. Timing of gonadotropin surge peak and duration of LH and FSH surges are shown in bottom left and right panels, respectively. Controls are shown as white bars, prenatal testosterone-treated as black bars, and prenatal DHT-treated as hatched bars. *P < 0.05; **P < 0.01. Two prenatal testosterone- and two DHT-treated (had high P4 levels during the test) females did not respond to the E2-positive feedback and are not included in analysis of surge attributes. P4 levels of nonresponder DHT-treated females were 4.6 and 5.5 ng/ml, respectively, thus blocking E2-positive feedback response [31].

