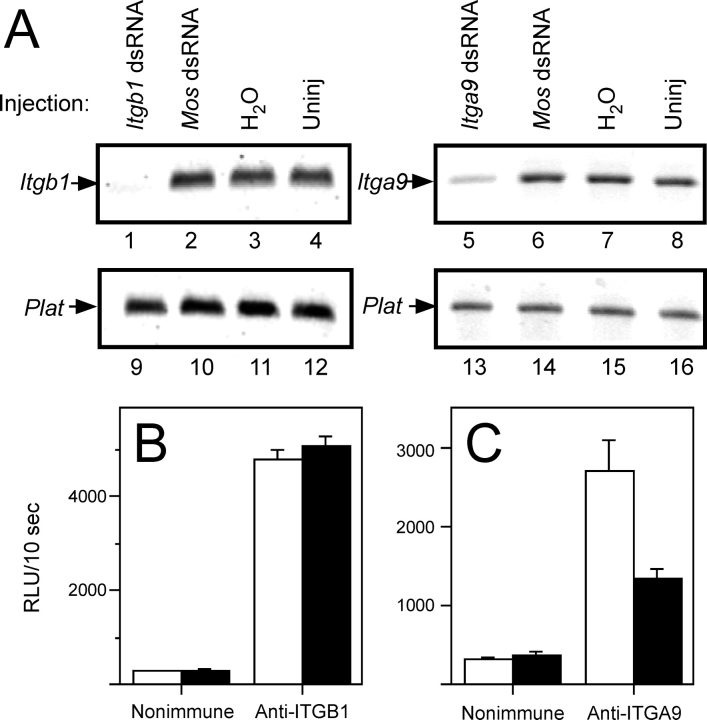
FIG. 3.
The mRNA and surface protein levels of Itgb1 (β1) and Itga9 (α9) in dsRNA-injected eggs. Messenger RNA levels were assessed by RT-PCR. A) Data from one representative experiment. Lanes 1–4 show the Itgb1 PCR product for Itgb1 dsRNA-injected (lane 1), Mos dsRNA-injected (lane 2), water-injected (lane 3), and uninjected (Uninj) (lane 4) eggs. Lanes 5–8 show the Itga9 PCR product for Itga9 dsRNA-injected (lane 5), Mos dsRNA-injected (lane 6), water-injected (lane 7), and uninjected (lane 8) eggs. Lanes 9–16 show the control Plat (tissue plasminogen activator) PCR product for Itgb1 or Itga9 dsRNA-injected (lanes 9 and 13), Mos dsRNA-injected (lanes 10 and 14), water-injected (lanes 11 and 15), and uninjected (lanes 12 and 16) eggs. This experiment was repeated five times for Itgb1 dsRNA and three times for Itga9 dsRNA. B and C) Analysis of egg surface protein levels for ITGB1 (B) and ITGA9 (C) using a luminometric immunoassay with anti-ITGB1 and anti-ITGA9 antibodies, respectively (solid bars), or species-matched nonimmune negative controls (open bars). These panels show data from representative luminometric assays, expressed as RLU/10 sec. This analysis was performed seven times for Itgb1 dsRNA-injected eggs and four times for Itga9 dsRNA-injected eggs (with 8–16 eggs analyzed per experimental group per experiment). Error bars represent the SEM.

