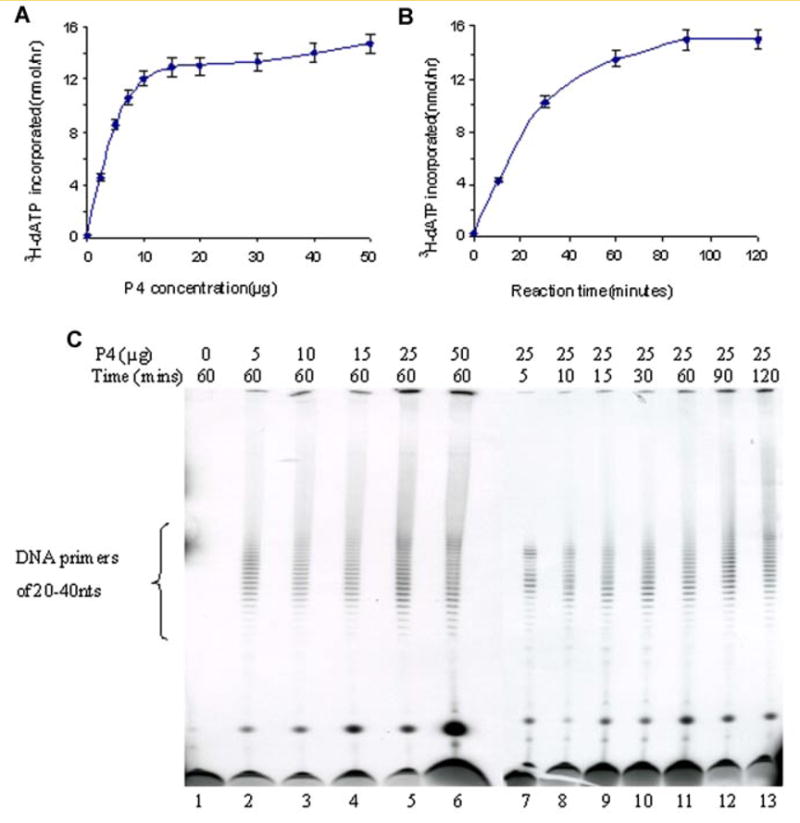
Fig. 3.

A,B: The abundance of DNA primers synthesized by the P4 fraction was measured using liquid scintillation counting as a function of either different concentrations of the P4 fraction (A) and or for different lengths of reaction time (B). C: Twenty percent denaturing gel electrophoretic analysis of DNA-primer products synthesized by various concentrations of the P4 fraction (lanes 2–6: 5–50 μg) or formed during reactions performed for various lengths of reaction time (lanes 7–13: 5–120 min). [Color figure can be viewed in the online issue, which is available at www.interscience.wiley.com.]
