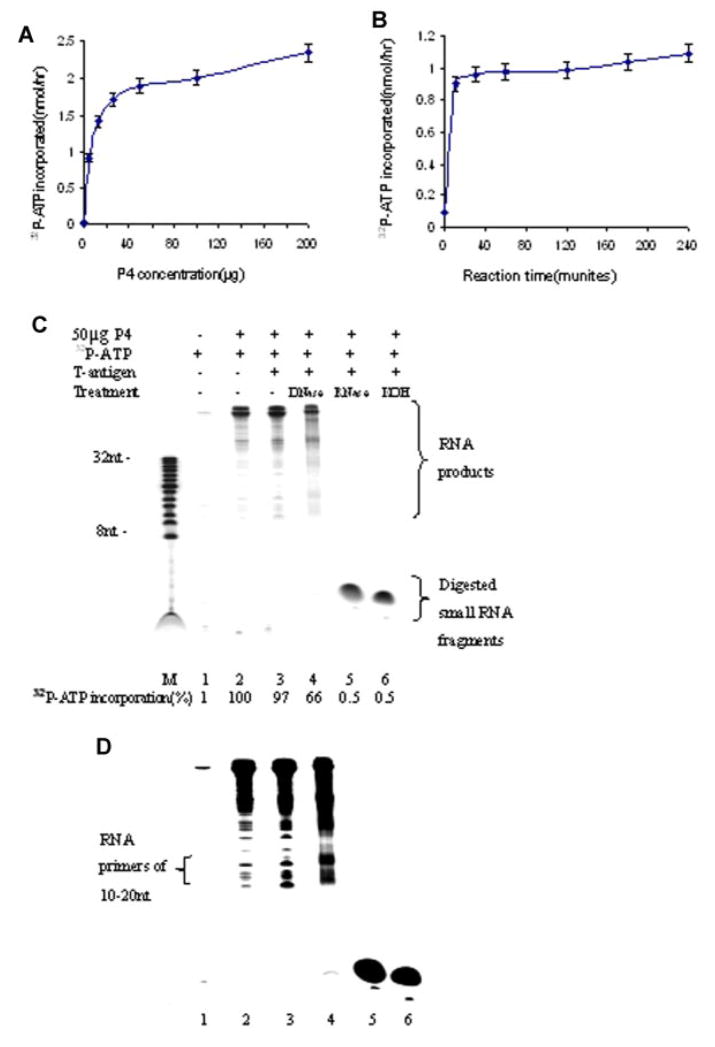
Fig. 8.
Quantification of the extent of RNA primer synthesis catalyzed by the human DNA synthesome as a function of the concentration of the P4 fraction added to the reaction mixture (A), and as a function of the length of the reaction time (B). Autoradiographic analysis of newly replicated RNA products following gel electrophoretic analysis through 22% polyacrylamide gels. C: Autoradiographic exposure time was 2 days. Lane 1 contains reaction products formed in the absence of the synthesome. Lanes 2 and 3 were RNA products formed in the absence or presence of SV40 large T-antigen, respectively. Lanes 4–6 contain different RNA products treated at 37°C for 1 h with either 10 U DNase I, or 10 U RNase A, or 0.3 N KOH, respectively. Lane M contains an 8–32 bp nucleotide marker. Newly replicated RNA products were quantified by liquid scintillation counting using 2 μl samples from each 25 μl reaction mixture. The percentage of (α-32P)-ATP incorporation into RNA was presented at the bottom of subpart (C). D: The same RNA products are shown as in subpart (C), with the exception that radiographic exposure time was increased to 7 days. [Color figure can be viewed in the online issue, which is available at www.interscience.wiley.com.]

