
Figure 5.
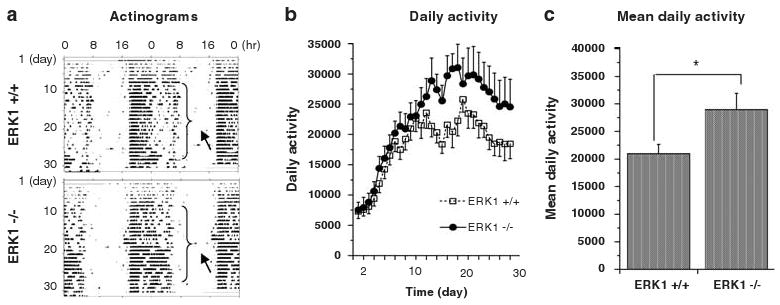
Daily voluntary wheel running activity. (a) Representative actinograms of WTand ERK1 KO mice. Arrows indicate increased daily voluntary wheel running duration in ERK1 KO mouse compared to a WT liter mate. (b) All mice showed increased voluntary wheel running activities over time (F(27, 1501) = 85.87; P < 0.001 for genotype and F(27, 501) = 11.35; P < 0.001 for day). (c) Mean daily voluntary wheel running activity in the home cage over 30 days was greater in ERK1 KO mice (t(58) = 4.125; P < 0.0001). *P < 0.05.