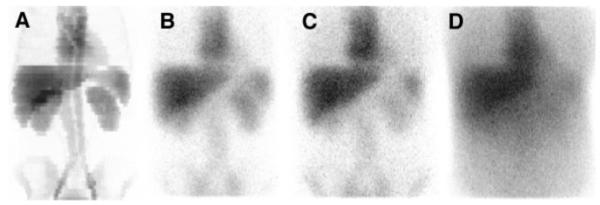
FIGURE 1.

(A) Planar projection of defined activity distribution. (B) Monte Carlo simulated projection image of 131I of same activity distribution in air, that is, including only deterioration caused by collimator response and septal penetration. (C) Projection image obtained when including attenuation and scatter, which thus simulates real patient situation. (D) Projection image obtained for 32- to 132-keV scatter energy window, used for image registration procedure.
