FIGURE 2.

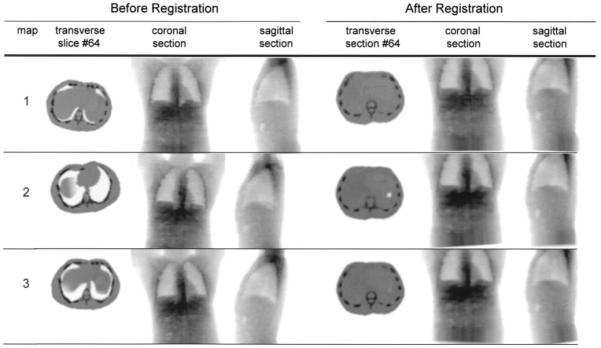
Mass density images used to mimic CT-derived mass density map for quantification. Maps 1–3 show transversal, coronal, and sagittal slices for the 3 test cases, before and after registration to SPECT image.

Mass density images used to mimic CT-derived mass density map for quantification. Maps 1–3 show transversal, coronal, and sagittal slices for the 3 test cases, before and after registration to SPECT image.