
FIGURE 4.
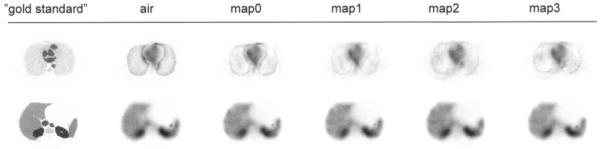
Transversal section of absorbed dose distribution for slice through lungs (top row) and liver (bottom row) for different cases. Images were all normalized to same gray level.
Official websites use .gov
A
.gov website belongs to an official
government organization in the United States.
Secure .gov websites use HTTPS
A lock (
) or https:// means you've safely
connected to the .gov website. Share sensitive
information only on official, secure websites.
Transversal section of absorbed dose distribution for slice through lungs (top row) and liver (bottom row) for different cases. Images were all normalized to same gray level.