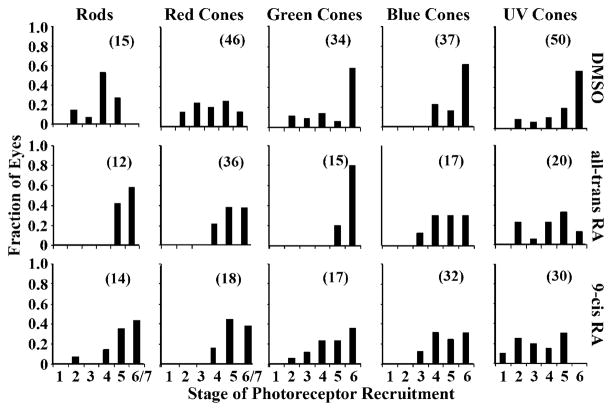
Fig. 2.
Fractions of eyes at different stages of photoreceptor recruitment after RA or a control treatment at 51 hpf and fixation at 75 hpf. Top row: eyes from DMSO-treated control embryos. Middle row: eyes from all-trans RA-treated embryos. Bottom row: eyes from 9-cis RA-treated embryos. Columns of panels, from left to right, show results for rods, red cones, green cones, blue cones, and UV cones. Stages 6 and 7 have been binned together in this figure. The numbers of eyes analyzed for each treatment/riboprobe combination are indicated parenthetically in each panel (the number of embryos analyzed in each case is approximately half the number of eyes).

