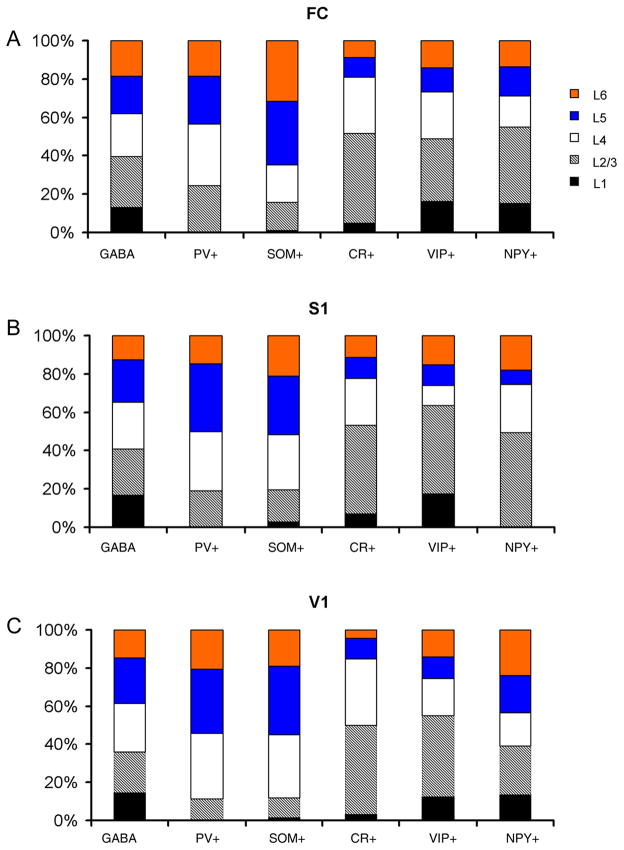
Fig. 5. The cumulative histograms showing percentage laminar distributions of marker-specific GABAergic cells in mouse FC, S1 and V1.
The labels on the horizontal axis indicate different markers. The histograms indicate the percentages of marker-positive cells with different colors and patterns coding different cortical layers.

