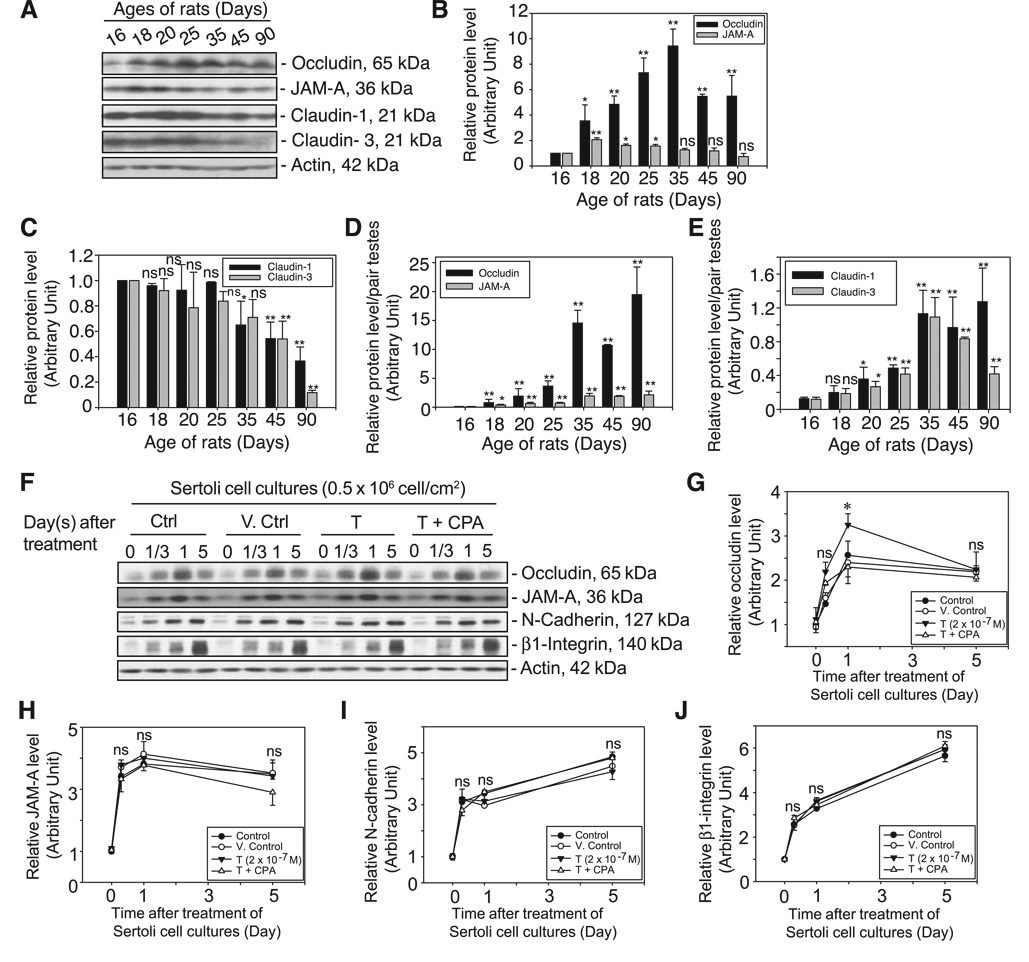
Figure 1.
In vivo and in vitro studies illustrating the significance of T on BTB dynamics in rats. Lysates from normal rat testes at different ages (days 16–90, postpartum, n=3) were prepared as described in Materials and Methods. About 100 µg of protein from each sample within an experimental group was resolved by SDS-PAGE and probed with several TJ integral membrane protein markers by immunoblotting (A). Results of this study are summarized in B–E. On the day after Sertoli cells were isolated from 20-day-old rat testes (time 0), cells were incubated immediately with 2 × 10⁻⁷ M T or T with 1 × 10⁻⁶ M CPA vs. Sertoli cells alone (Ctrl) and with a corresponding volume of ethanol, which served as the vehicle control (V. Ctrl), and the reaction was terminated after 8 h, 1 day, and 5 days (F). About 100 µg of protein from each sample was resolved by SDS-PAGE and probed with several TJ and AJ integral membrane proteins. All blots in A and F were stripped and reprobed with an anti-actin antibody to assess equal protein loading. The level of each target protein shown in A and F was densitometrically scanned and compared in B–E and G–J, respectively. Each bar is the mean ± sd of three sets of samples. The protein levels at day 16 in A and time 0 in F were arbitrarily set at 1. Statistical analysis was performed with two-way ANOVA using the repeated measures model followed by Dunnett’s test, comparing the steady-state protein levels of target proteins at other ages vs. that at day 16 as well as between samples (B, C) (n=3 rats for each time point). Data from B and C were also expressed as protein levels per pair of testes by taking into consideration changes in testis weights during maturation and shown in the corresponding bar graphs in D and E. Changes in target protein levels after treatment of Sertoli cells with T or T + CPA were compared with the corresponding control and vehicles (V. Ctrl) at each time point (G–J) by two-way ANOVA followed by Dunnett’s test. Each bar is the mean ± sd of three experiments using different batches of Sertoli cells. *P < 0.05; ns, not significantly different.

