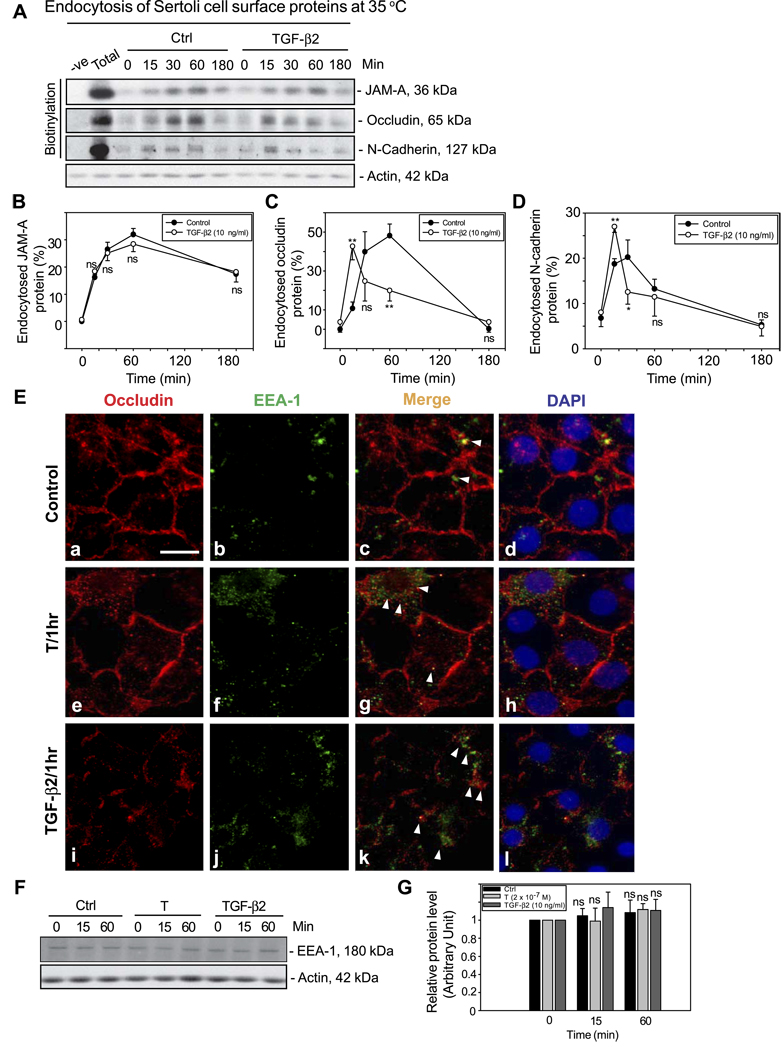
Figure 3.
Endocytosis assay illustrating cytokines (e.g., TGF-β2) perturb the BTB by accelerating the kinetics of the internalization of BTB-integral membrane proteins using an in vitro model. A) After cell surface protein biotinylation, Sertoli cells were incubated with or without 10 ng/ml recombinant TGF-β2 at 35°C to allow endocytosis, and the reactions were terminated at various time points. About 400 µg of protein from different samples at each time point within a given experiment was used to estimate the kinetics of protein endocytosis by immunoblotting after their extraction by NeutrAvidin Plus beads. B–D) Kinetics of internalization of JAM-A, occludin, and N-cadherin with or without treatment with TGF-β2. The percentage of internalized proteins vs. total biotinylated proteins is shown on the y axis and plotted against time (x axis). Each data point is the mean ± sd of three independent experiments using different batches of Sertoli cell cultures. In each experiment, each time point had triplicate cultures. Statistical analysis was performed by two-way ANOVA followed by Dunnett’s test to compare treatment group (i.e., TGF-β2-treated Sertoli cells) against controls and over time. *P < 0.01; **P < 0.001; ns, not significantly different. E) Internalized occludin vesicles (red fluorescence, Cy3) in e and i were found to colocalize with an early endosome marker (EEA-1, green fluorescence, FITC; see f, j) as shown in merged images (g, k) when cells were treated with T (2×10⁻⁷ M) or TGF-β2 for 1 h (white arrowheads). DAPI (d, h, l) stained the cell nuclei. Scale bar = 10 µm. F) A study by immunoblot analysis using lysates from the endocytosis experiments shown in A before avidin beads extraction to assess the relative protein levels of EEA-1 in Sertoli cells in the absence (Ctrl, control) or presence of T (2×10⁻⁷ M) and TGF-β2 (10 ng/ml). Actin served as a protein loading control. G) Results shown in F were densitometrically scanned and analyzed. Each bar is the mean ± sd of results from three different experiments wherein the EEA-1 level at time 0 was arbitrarily set at 1. Statistical analysis was performed by two-way ANOVA followed by Dunnett’s test, comparing the steady-state protein levels of EEA-1 in each treatment group (T or TGF-β2) vs. its corresponding control at time 0. ns, not significantly different.

